


I 'heart' Hotjar
We’re always looking for ways to increase conversion rates for clients. Whether it’s a yearly subscription to your website, a sale of your product to a returning customer or a micro conversion such as a newsletter sign-up, account creation or just browsing your site for an extended amount of time.
All of these conversion points can be tracked using Google Analytics but I’ve been using HotJar on a number of client websites as a means to providing more colour around the user behaviours that lead to a successful or unsuccessful conversion event.
Here are a few of the key reports you can set up to support your analytics findings.
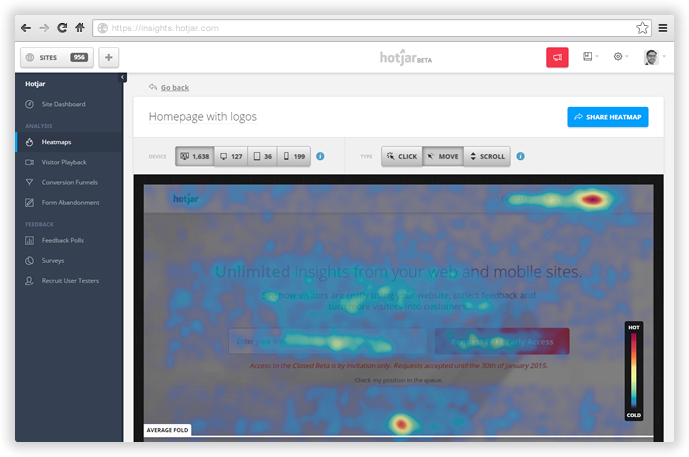
Heatmaps
OK, heatmapping is nothing new and you can pretty much guess that you’re just going to see lots of heat at the top of the page and a steady dissipation as you move down the page. I suppose the cool thing with heatmapping in HotJar is that it’s easy to access click, taps and scrolling behaviour (indicators of motivation and desire) next to a suite of the other reports below.
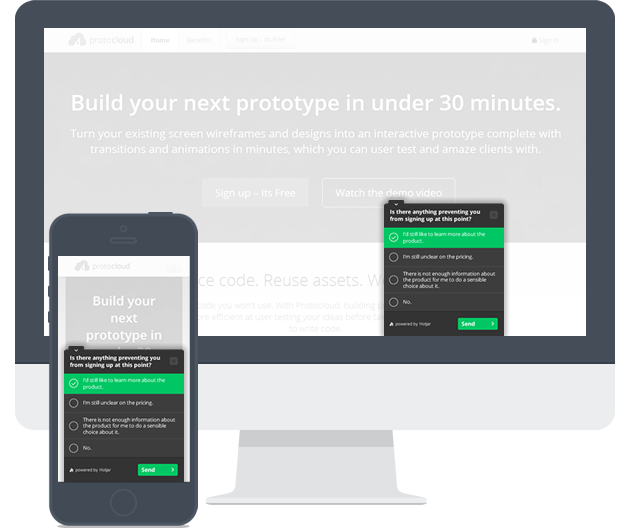
Feedback polls
Getting feedback from users helps you understand what they want from a certain part of your website. Polls can be quickly created & launched on a per page basis which allows you to look for excessive negative feedback in all areas of your website and then take action to improve that feedback.
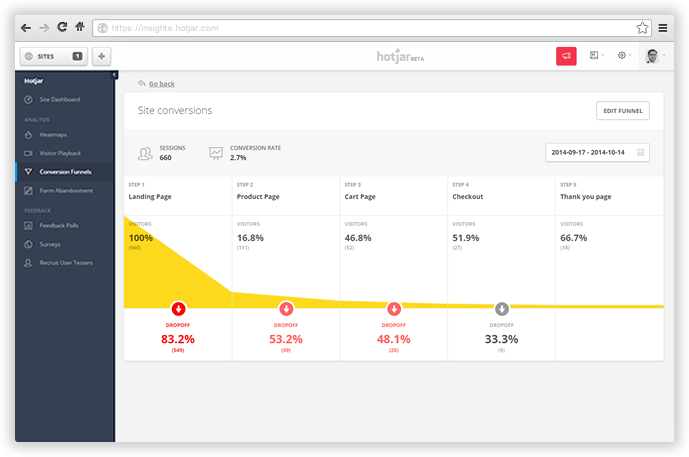
Conversion Funnels
I love this report. It’s a great way to find where you’re dropping conversion opportunities. Google analytics provides the same sort of reporting but in my opinion it’s an easier job setting up conversion funnel reporting in Hotjar and the analysis interface is better than google analytics. My favourite feature here is being able to click a button from each step of the funnel which shows you visitor recordings of people dropping out from that stage of the form. So cool.
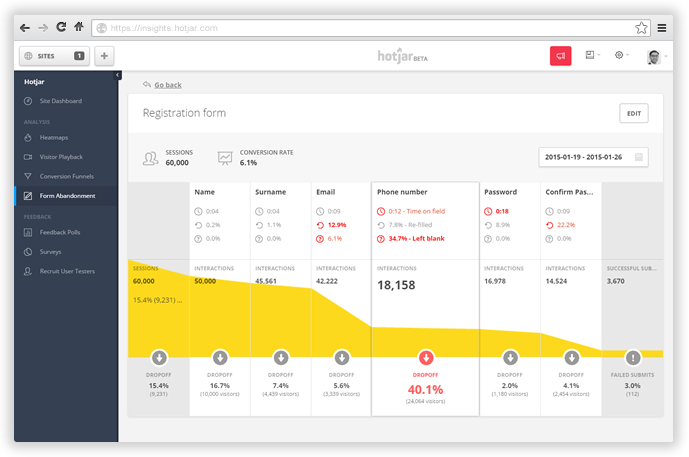
Form Analytics
Form analytics is a similar interface to the conversion funnel report but it focusses on each field of your form and gives you average times that users take to fill out each field, how many people skip each field, and again suggests reasons as to why visitors are abandoning your form. Finally, no more guessing as to which fields are causing pain to you form completion rates.
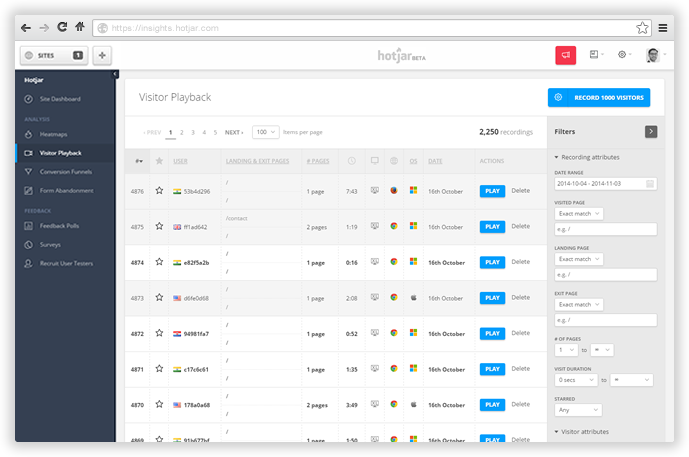
Visitor Recordings
Do you like to watch? Fulfil your voyeuristic tendencies to no end with the visitor recording feature. It’s just like sitting behind the user and watching them visit your site in real time. Actually, it’s even better than real time. You can save your own time by speeding up the recordings up to 4x and skipping pause moments where the user gets up to get a cup of tea.
The visitor recording feature is incredibly useful when you’ve identified a problem through another report and need to see what’s actually happening where the problem exists.
I’ve yet to see a site where a tool like HotJar would not be useful. While the team over at Hotjar have done a great job at making analysis easier by centralising/ integrating several tools, the task of administering and deriving insight from still rests with someone who knows the right questions to ask.
If your developer isn’t talking to you about Hotjar or a similar analytics/testing service you should probably be asking them why not.