


A web based Microsoft Project alternative
My role as a Digital Producer/Project Manager involves a lot of planning. Successful projects need a solid timeline, and an accurate method of tracking progress is essential to managing client commitments and the internal scheduling of resources.
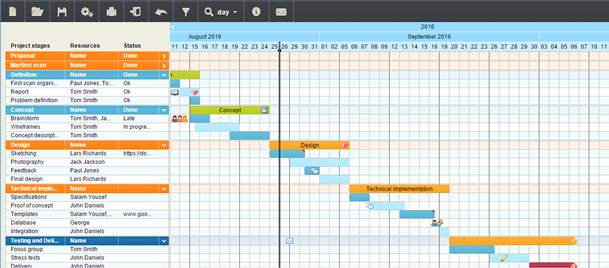
The best way to visualise a timeline? A Gantt chart of course.
If you ask a group of project managers, or anyone involved in project work for that matter, how to create a Gantt chart they will likely tell you to pick up a copy of Microsoft Project. It’s the go-to solution and its trusted to be the best thanks only to the reputation of its developer.
Now ask the same group if they enjoy working with MS project. The answer will most likely be no, but that they put up with it because it’s the industry standard. The truth is that Project, like many Microsoft products, is clunky. The interface is inflexible and unintuitive and the charts that it produces are so dull looking that they will make clients want to ignore them. [Insert enormous novelty-sized red flag here].
Sure, if you’re running a 10 year long construction project with hundreds of intertwined dependencies and a scope that is unlikely to change drastically then Project could well be the tool for you. But in our Industry things move faster and change often. We need something more flexible, more accessible and more collaborative.
I’ve tried a number of alternative tools over the years, including an entirely manual process consisting of coloured cells in a spreadsheet (let's call this an MVP approach). The tool I’ve had the most success with recently goes by the name of Tom’s Planner. Not the most imaginative name but a great little web based tool that easily lets you drag chart blocks around. It doesn’t support dependencies but in exchange it offers a flexible, intuitive interface that lets you create and manage charts that people might actually want to look at.
I now use it to create high level plans of my team's capacity, weekly schedules for resources and detailed project plans. These charts can be accessed from the browser which is great for meetings and you can share read only copies with clients so they never feel left in the dark. They also support a variety of export formats including MS Project, though I’m yet to find the need to experiment with anything other than printable PDFs.
My only gripe is that the collaborative features are a little primitive. Though you can share access to a chart, only one user can edit it at a time. A Google Docs style approach could solve this but for me it’s not a deal breaker.